EFFIS rapid perimeters, updated weekly during fire season
Author
Pierre Beaucoral
Published
September 3, 2026
How bad is this fire season, and how would you actually know? This tracker follows Europe’s wildfire season as it unfolds. Satellites spot wildfires (large ones reliably, and increasingly small ones too), and Europe’s EFFIS service, part of the Copernicus programme, draws the outline of each burned area it can map. During the fire season (June to September) this site refreshes weekly: a pipeline fetches the newest outlines, stores a dated copy under DATA/snapshots/, and every chart re-renders from that copy. Fire sizes are measured directly from the mapped shapes, in a map projection that keeps areas honest, and each fire is assigned to the country it overlaps most. Same method as the 2025 season analysis this project grew from.
Show code
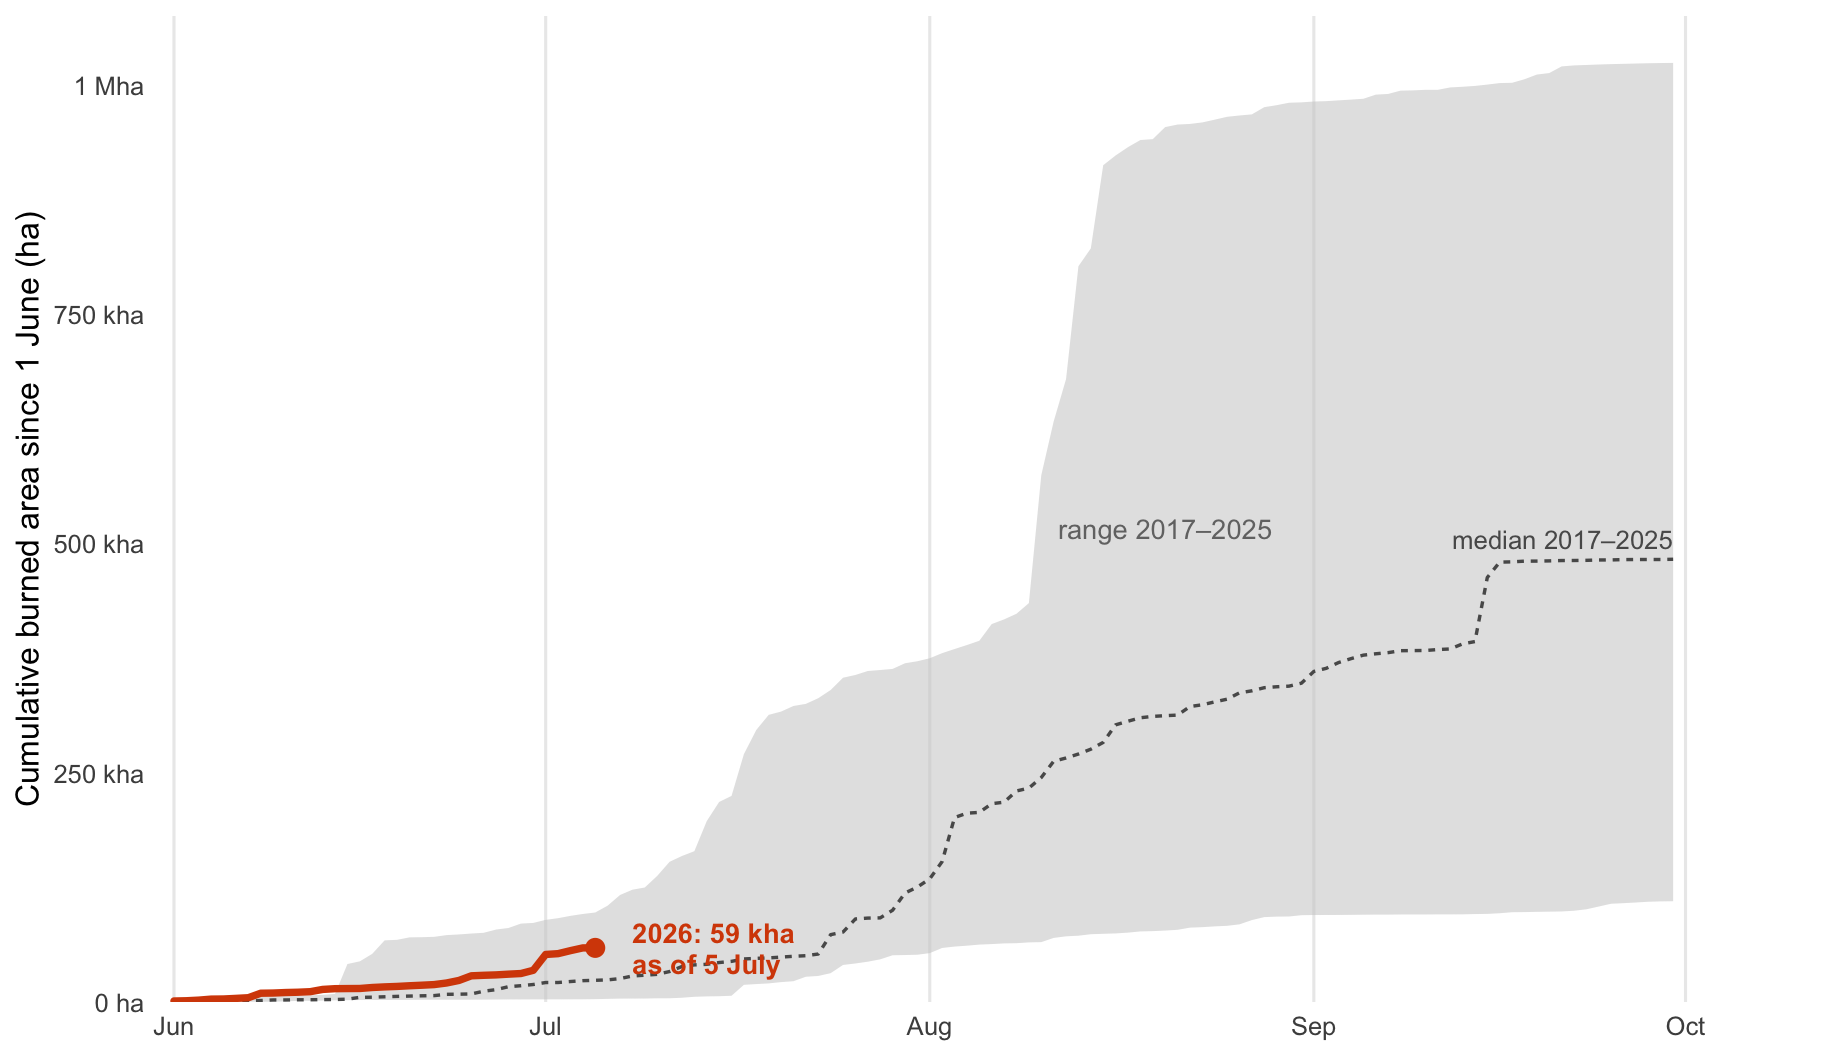
# Reads the SAME cached envelope object as posts/2026.qmd (identical cache# key via build_envelope) -- nothing heavy is recomputed here.library(sf)library(dplyr)library(tibble)library(purrr)library(lubridate)library(ggplot2)library(scales)library(janitor)library(rnaturalearth)Sys.setenv(OGR_GEOJSON_MAX_OBJ_SIZE ="0")source(file.path("R", "helpers.R"))source(file.path("R", "geo.R"))source(file.path("R", "cache.R"))source(file.path("R", "theme.R"))source(file.path("R", "pipeline.R"))source(file.path("R", "plots.R"))source(file.path("scripts", "latest_snapshot.R"))snap <-latest_snapshot()stopifnot(!is.na(snap))eu <-get_eu()envelope <-build_envelope(hist_years =2017:2025, year_current =2026L,snapshot_dir = snap, eu = eu,start_month =6L, end_month =9L)m <- envelope$metaas_of_lab <-paste(day(m$as_of_date), month.name[month(m$as_of_date)])cap_envelope <-sprintf(paste("Cumulative burned area since 1 June: 2026 to date against the 2017–2025","range (shaded band: min–max; dashed line: median). The 2026 line stops at","its last mapped perimeter (%s)." ), as_of_lab)
Season at a glance, as of 2 September 2026
Table 1: Totals count only the parts of each fire inside Europe (snapshot 2026-09-03). Fire counts are not comparable across years because the detection system changed; the median comparison uses burned area. Details on the season page.
How much has burned since 1 June
In how many separate fires
Compared with a typical recent season
669 kha
3,419
184%
Show code
plot_envelope(envelope)
Cumulative burned area since 1 June: 2026 to date against the 2017–2025 range (shaded band: min–max; dashed line: median). The 2026 line stops at its last mapped perimeter (2 September).
The full picture (hero and interactive maps, country rankings, raw and normalized by land area, re-burn analysis, and what vegetation is burning) lives on the 2026 season page, updated with each snapshot.
Source Code
---title: "Europe Wildfire Season Tracker"subtitle: "EFFIS rapid perimeters, updated weekly during fire season"author: "Pierre Beaucoral"date: todayexecute: freeze: false---How bad is this fire season, and how would you actually know? This trackerfollows Europe's wildfire season as it unfolds. Satellites spot wildfires(large ones reliably, and increasingly small ones too), and Europe's **EFFIS** service,part of the Copernicus programme, draws the outline of each burned area itcan map. During the fire season (**June to September**) this site refreshes**weekly**: a pipeline fetches the newest outlines, stores a dated copy under`DATA/snapshots/`, and every chart re-renders from that copy. Fire sizes aremeasured directly from the mapped shapes, in a map projection that keepsareas honest, and each fire is assigned to the country it overlaps most. Samemethod as the [2025 season analysis](posts/2025.qmd) this project grew from.```{r}#| label: tracker-data# Reads the SAME cached envelope object as posts/2026.qmd (identical cache# key via build_envelope) -- nothing heavy is recomputed here.library(sf)library(dplyr)library(tibble)library(purrr)library(lubridate)library(ggplot2)library(scales)library(janitor)library(rnaturalearth)Sys.setenv(OGR_GEOJSON_MAX_OBJ_SIZE ="0")source(file.path("R", "helpers.R"))source(file.path("R", "geo.R"))source(file.path("R", "cache.R"))source(file.path("R", "theme.R"))source(file.path("R", "pipeline.R"))source(file.path("R", "plots.R"))source(file.path("scripts", "latest_snapshot.R"))snap <-latest_snapshot()stopifnot(!is.na(snap))eu <-get_eu()envelope <-build_envelope(hist_years =2017:2025, year_current =2026L,snapshot_dir = snap, eu = eu,start_month =6L, end_month =9L)m <- envelope$metaas_of_lab <-paste(day(m$as_of_date), month.name[month(m$as_of_date)])cap_envelope <-sprintf(paste("Cumulative burned area since 1 June: 2026 to date against the 2017–2025","range (shaded band: min–max; dashed line: median). The 2026 line stops at","its last mapped perimeter (%s)." ), as_of_lab)```## Season at a glance, as of `r as_of_lab` `r m$year_current`| How much has burned since 1 June | In how many separate fires | Compared with a typical recent season ||:---:|:---:|:---:|| **`r lab_si_ha(m$current_cum_ha)`** | **`r comma(m$current_n_fires)`** | **`r if (is.na(m$pct_vs_median)) "n/a (too early in season)" else sprintf("%.0f%%", m$pct_vs_median)`** |: Totals count only the parts of each fire inside Europe (snapshot `r basename(snap)`). Fire *counts* are not comparable across years because the detection system changed; the median comparison uses burned *area*. Details on the [season page](posts/2026.qmd). {#tbl-glance}```{r}#| label: tracker-envelope#| fig-width: 9.5#| fig-height: 5.5#| fig-cap: !expr cap_envelopeplot_envelope(envelope)```**The full picture** (hero and interactive maps, country rankings, raw andnormalized by land area, re-burn analysis, and what vegetation is burning)lives on the **[2026 season page](posts/2026.qmd)**, updated with eachsnapshot.