
JUL 6, 2026 · 3 MIN
From a look back to a live watch
Last September I wrote up the 2025 wildfire season after it was over. It started, like a lot of my curiosity about this topic, with the fires in Aude, close to home, and with the large outbreaks in Spain and Portugal. That post was a retrospective: one snapshot, taken once the smoke had cleared.
This year I wanted something different. Instead of waiting for the season to end, I turned the analysis into a living tracker that follows Europe’s 2026 fires as they are mapped. It reads the latest EFFIS rapid perimeters (the satellite-mapped outlines of burned areas, for fires roughly 30 hectares and above), rebuilds every map and chart from scratch, and reports where things stand right now.
A living page, not a fixed one
The important word is living. I refresh the tracker through the fire season and rebuild it from a fresh download each time, so the picture keeps up with the fires rather than freezing on one date. The numbers I quote below are a moment in time, early July 2026. For the current figures, the tracker itself is always the reference, and it is the honest place to look because rapid mapping gets revised: perimeters are refined, merged, and added for weeks after a fire.
What the data shows so far
A few things already stand out in 2026.
The season started early. The surprise of the year is not the summer at all. Most of what has burned in Europe so far this year burned before June, with a peak in late February. Winter and spring fires, largely on farmland and moorland, added up to far more area than the summer has produced yet.
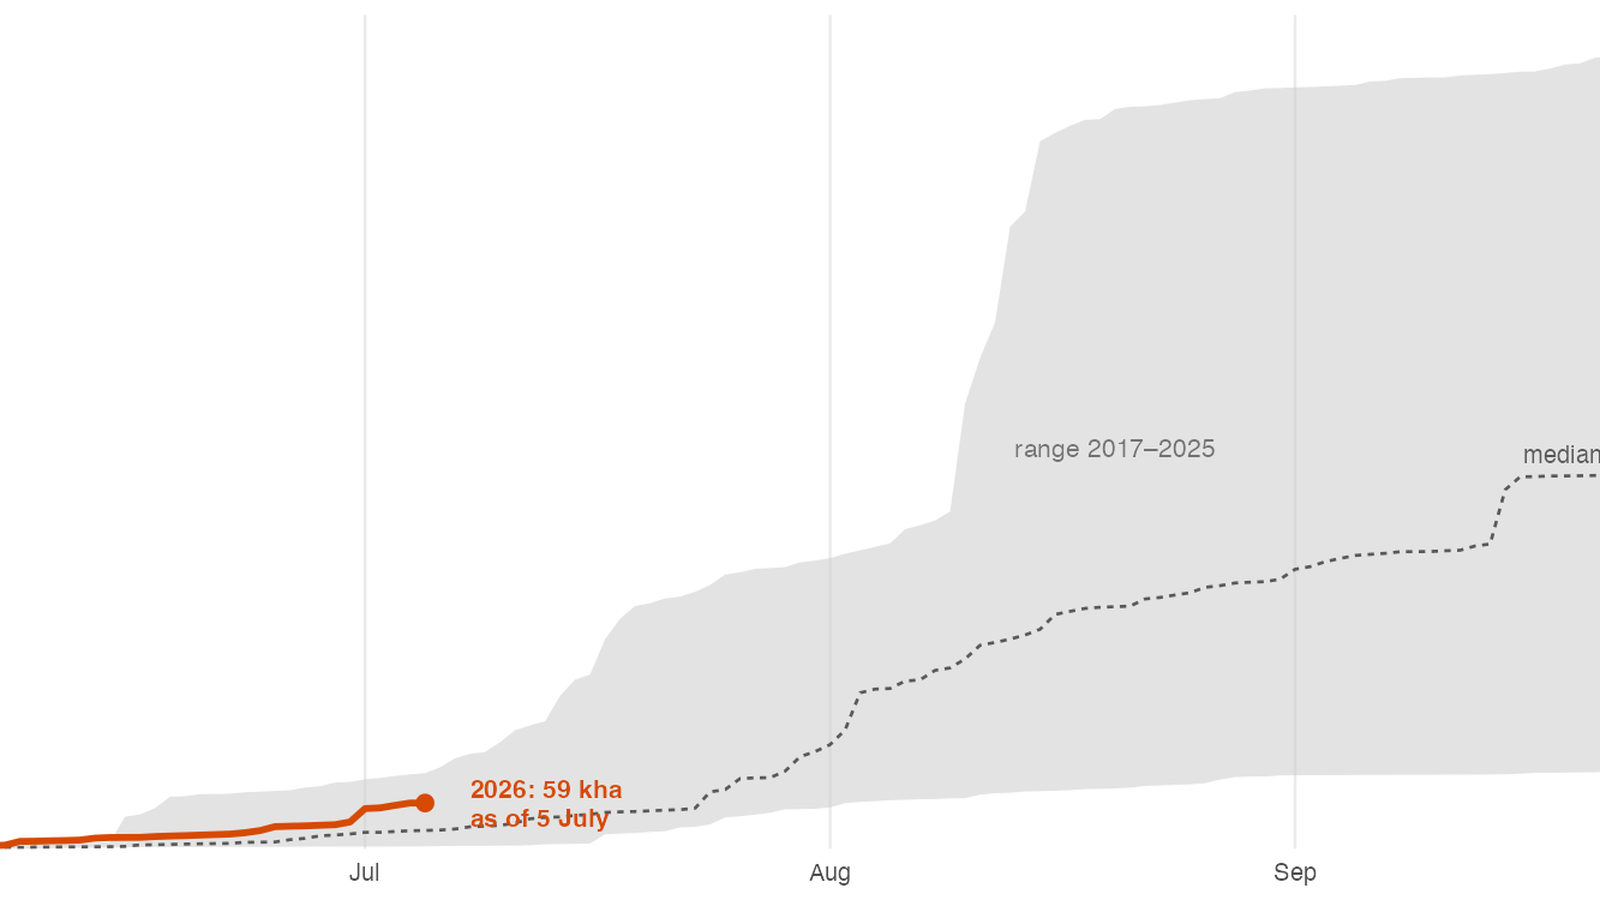
The summer is running hot. Since the start of June, burned area is well above what a typical recent year had reached by this point, around two and a half times the 2017 to 2025 median for early July. It is early, and I will not call a season in its first weeks, but the pace is clearly elevated rather than ordinary.
A lot of it is familiar ground. Roughly four in every ten hectares that burned in 2026 sit on land that already burned at least once in the previous decade. France in particular is re-burning ground it has burned before, while Spain and Portugal are more often breaking new ground. That is a description of overlap, not a verdict on why, but it is the kind of pattern worth watching.
Protected nature is in the mix. A meaningful share of the burned area falls inside Natura 2000 sites, Europe’s network of protected habitats, which the tracker follows week to week.
How it works, and what it is not
Everything rests on EFFIS rapid mapping, so everything here is an estimate, not an official total. Rapid perimeters systematically miss the smallest fires, and national statistics can differ because of thresholds, definitions, and timing. One subtlety matters for comparisons across years: EFFIS moved its mapping toward Sentinel-2 detection, so the raw count of fires jumped when smaller fires became detectable. That is why the tracker leans on burned area, which is dominated by large fires, whenever it compares one year to another. Fire counts across years are not apples to apples.
For anything operational, national and European agencies remain the authority. This is exploratory work, meant to make the season legible, not to replace official reporting.
See it live
The full interactive tracker, with the maps, the season-versus-history chart, the re-burn analysis, and a tool to drop each of the year’s largest fires onto the real outline of Paris for scale, lives here and stays current:
Europe Wildfire Season Tracker
I will keep it updated through the season.