
September 2024
R programming for beginners
This course website accompanies the introductory R course taught in the Master GPE (CERDI / IHEDD). It is designed for students with no prior experience of programming or data analysis: 6 sessions of 3 hours (18 hours in total).
The running thread is a single question, “Growth, health and inequality: what do the data say about developing countries?”, explored with World Bank (WDI) and World Inequality Database (WID) data.
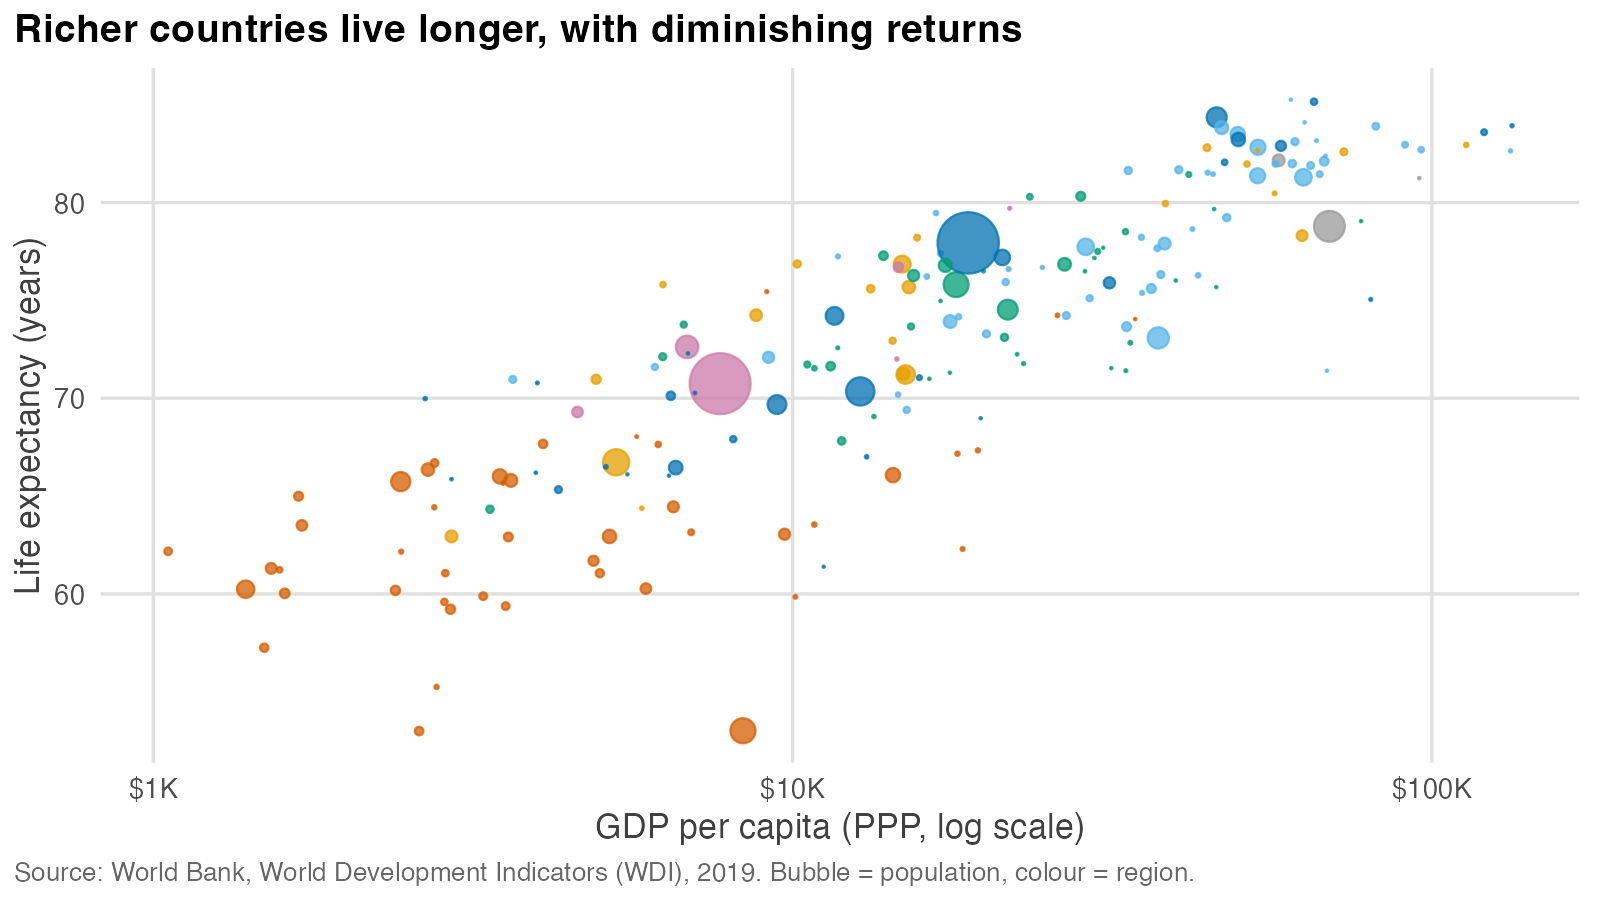
Each session page mixes the R code with charts of the results, diagrams of the key concepts (the pipe, joins, reshaping, how a report is built), short “Key idea” and “Common mistake” boxes, and exercises with collapsible solutions.
Objectives
By the end of the course, you will be able to:
- Work comfortably in R and RStudio.
- Import, clean and combine real-world datasets.
- Describe data and estimate simple regressions.
- Communicate results with clear figures, maps and reproducible Quarto reports.
Sessions
- Getting started with R and RStudio
- Importing and exporting data
- Data manipulation (dplyr, tidyr, joins)
- Descriptive statistics and regression
- Visualising with ggplot2 (and maps)
- Advanced visualisation and Quarto reports
Dataviz workshop (in French): Atelier dataviz, une figure pour la note au ministre.
See also the resources page for references and data sources.
Before the first session
- Install R and then RStudio Desktop.
- Download the course data archive (data.zip) and unzip it in a folder you will use for the course.
Last updated: 14 October 2026.
TeachingR