
Interactive tools I build to make open data explorable.
Fast, static web apps - no backend, no cold start. The browser does the work, and every view is a shareable URL.
Ember
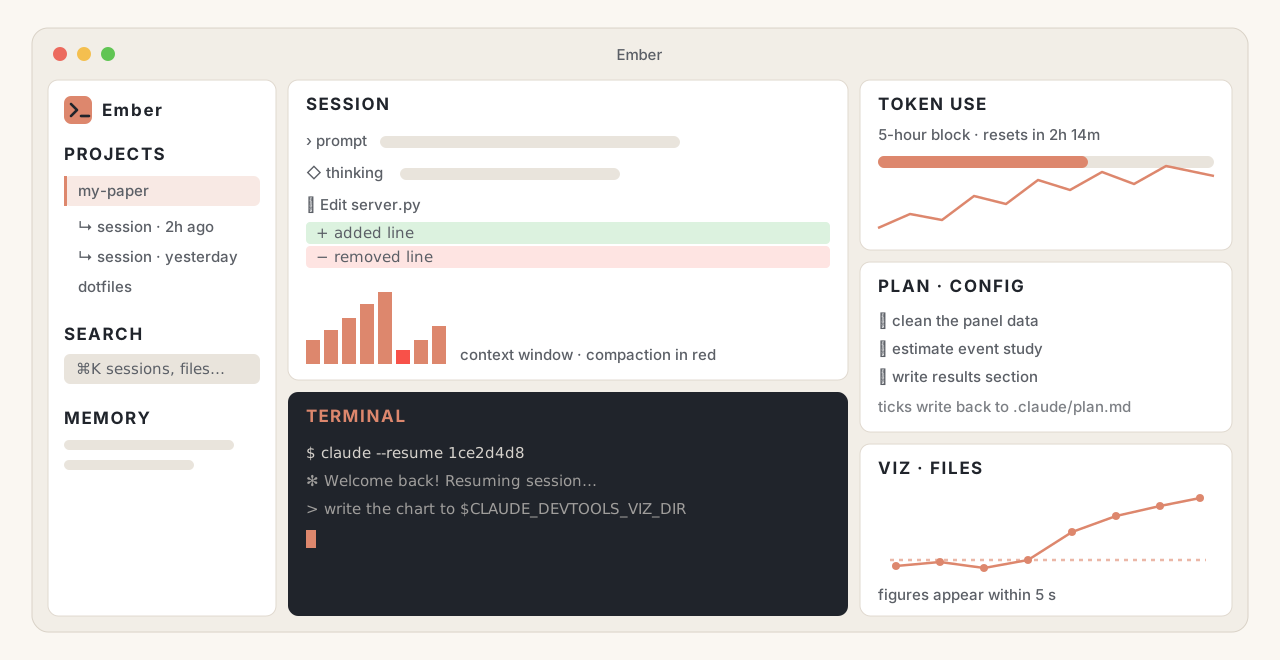
A workspace for Claude Code: your sessions, a real terminal, your plan and your token budget in one local window, laid out like RStudio. When an AI agent cleans your data, runs your regressions or edits your paper, the terminal shows only a summary. Ember shows everything: every prompt, every command it ran with its output, the exact diff of every file it touched, its reasoning, and how many tokens it used.
For researchers, that makes AI-assisted work auditable. You can trace a number in a table back to the command that produced it, check that an agent did not quietly change a sample restriction, and keep a record of the workflow for replication packages and method sections. Full-text search across sessions finds last month's analysis, and one click resumes it in the built-in terminal. A live plan pane tracks the agent's to-do list, and figures it writes appear in a preview pane where you can pin comments. It reads transcripts read-only, with no dependencies, no API keys and no data leaving your computer. Download the app for macOS, Linux or Windows, or run it from source with Python.
Europe Wildfire Season Tracker
A live watch of Europe's 2026 fire season, rebuilt from fresh EFFIS satellite perimeters and refreshed through the summer. It maps where and when the continent is burning, sets the season against the last decade, measures how much is re-burning old ground, and lets you drop each of the year's largest fires onto the real outline of Paris for scale.
EasyViz
A static World Bank WDI explorer that loads in under a second. Search 100+ indicators, chart with country presets, run OLS and Gapminder-style animations, upload your own CSV - all in the browser, talking straight to the World Bank API.
France · Données ouvertes
A commune-level dashboard of French open data from data.gouv.fr: elections, housing, air quality, security, public finance, health, income, demographics, energy & carbon, mobility, and organic farming - plus bivariate maps, a correlation explorer, and small-multiples by département.