On the theory side, the paper embeds NAP adoption in a recipient–donor allocation model. A donor
splits a fixed global budget across countries and, within each country, between adaptation aid and other
aid using nested CES aggregators. NAP adoption enters as a policy-driven rise in a country's effective
adaptive capacity Vi, generating two empirically separable channels:
- Composition channel: higher perceived capacity raises the adaptation share of a country's envelope.
- Envelope (scale) channel: higher perceived returns may expand the total envelope allocated to adopters — but need not.
- Global reallocation: adopters should capture a larger share of a broadly fixed global adaptation pool.
The model maps the IPCC AR6 risk components onto aid-allocation motives: time-invariant hazard is a
primitive absorbed by country fixed effects; slow-moving exposure/sensitivity enter as controls; and
adaptive capacity — the merit margin — is the only component NAP adoption shifts. This is what makes
NAP submission an information shock to capacity rather than a shock to climate need.
On the empirical side, the paper combines:
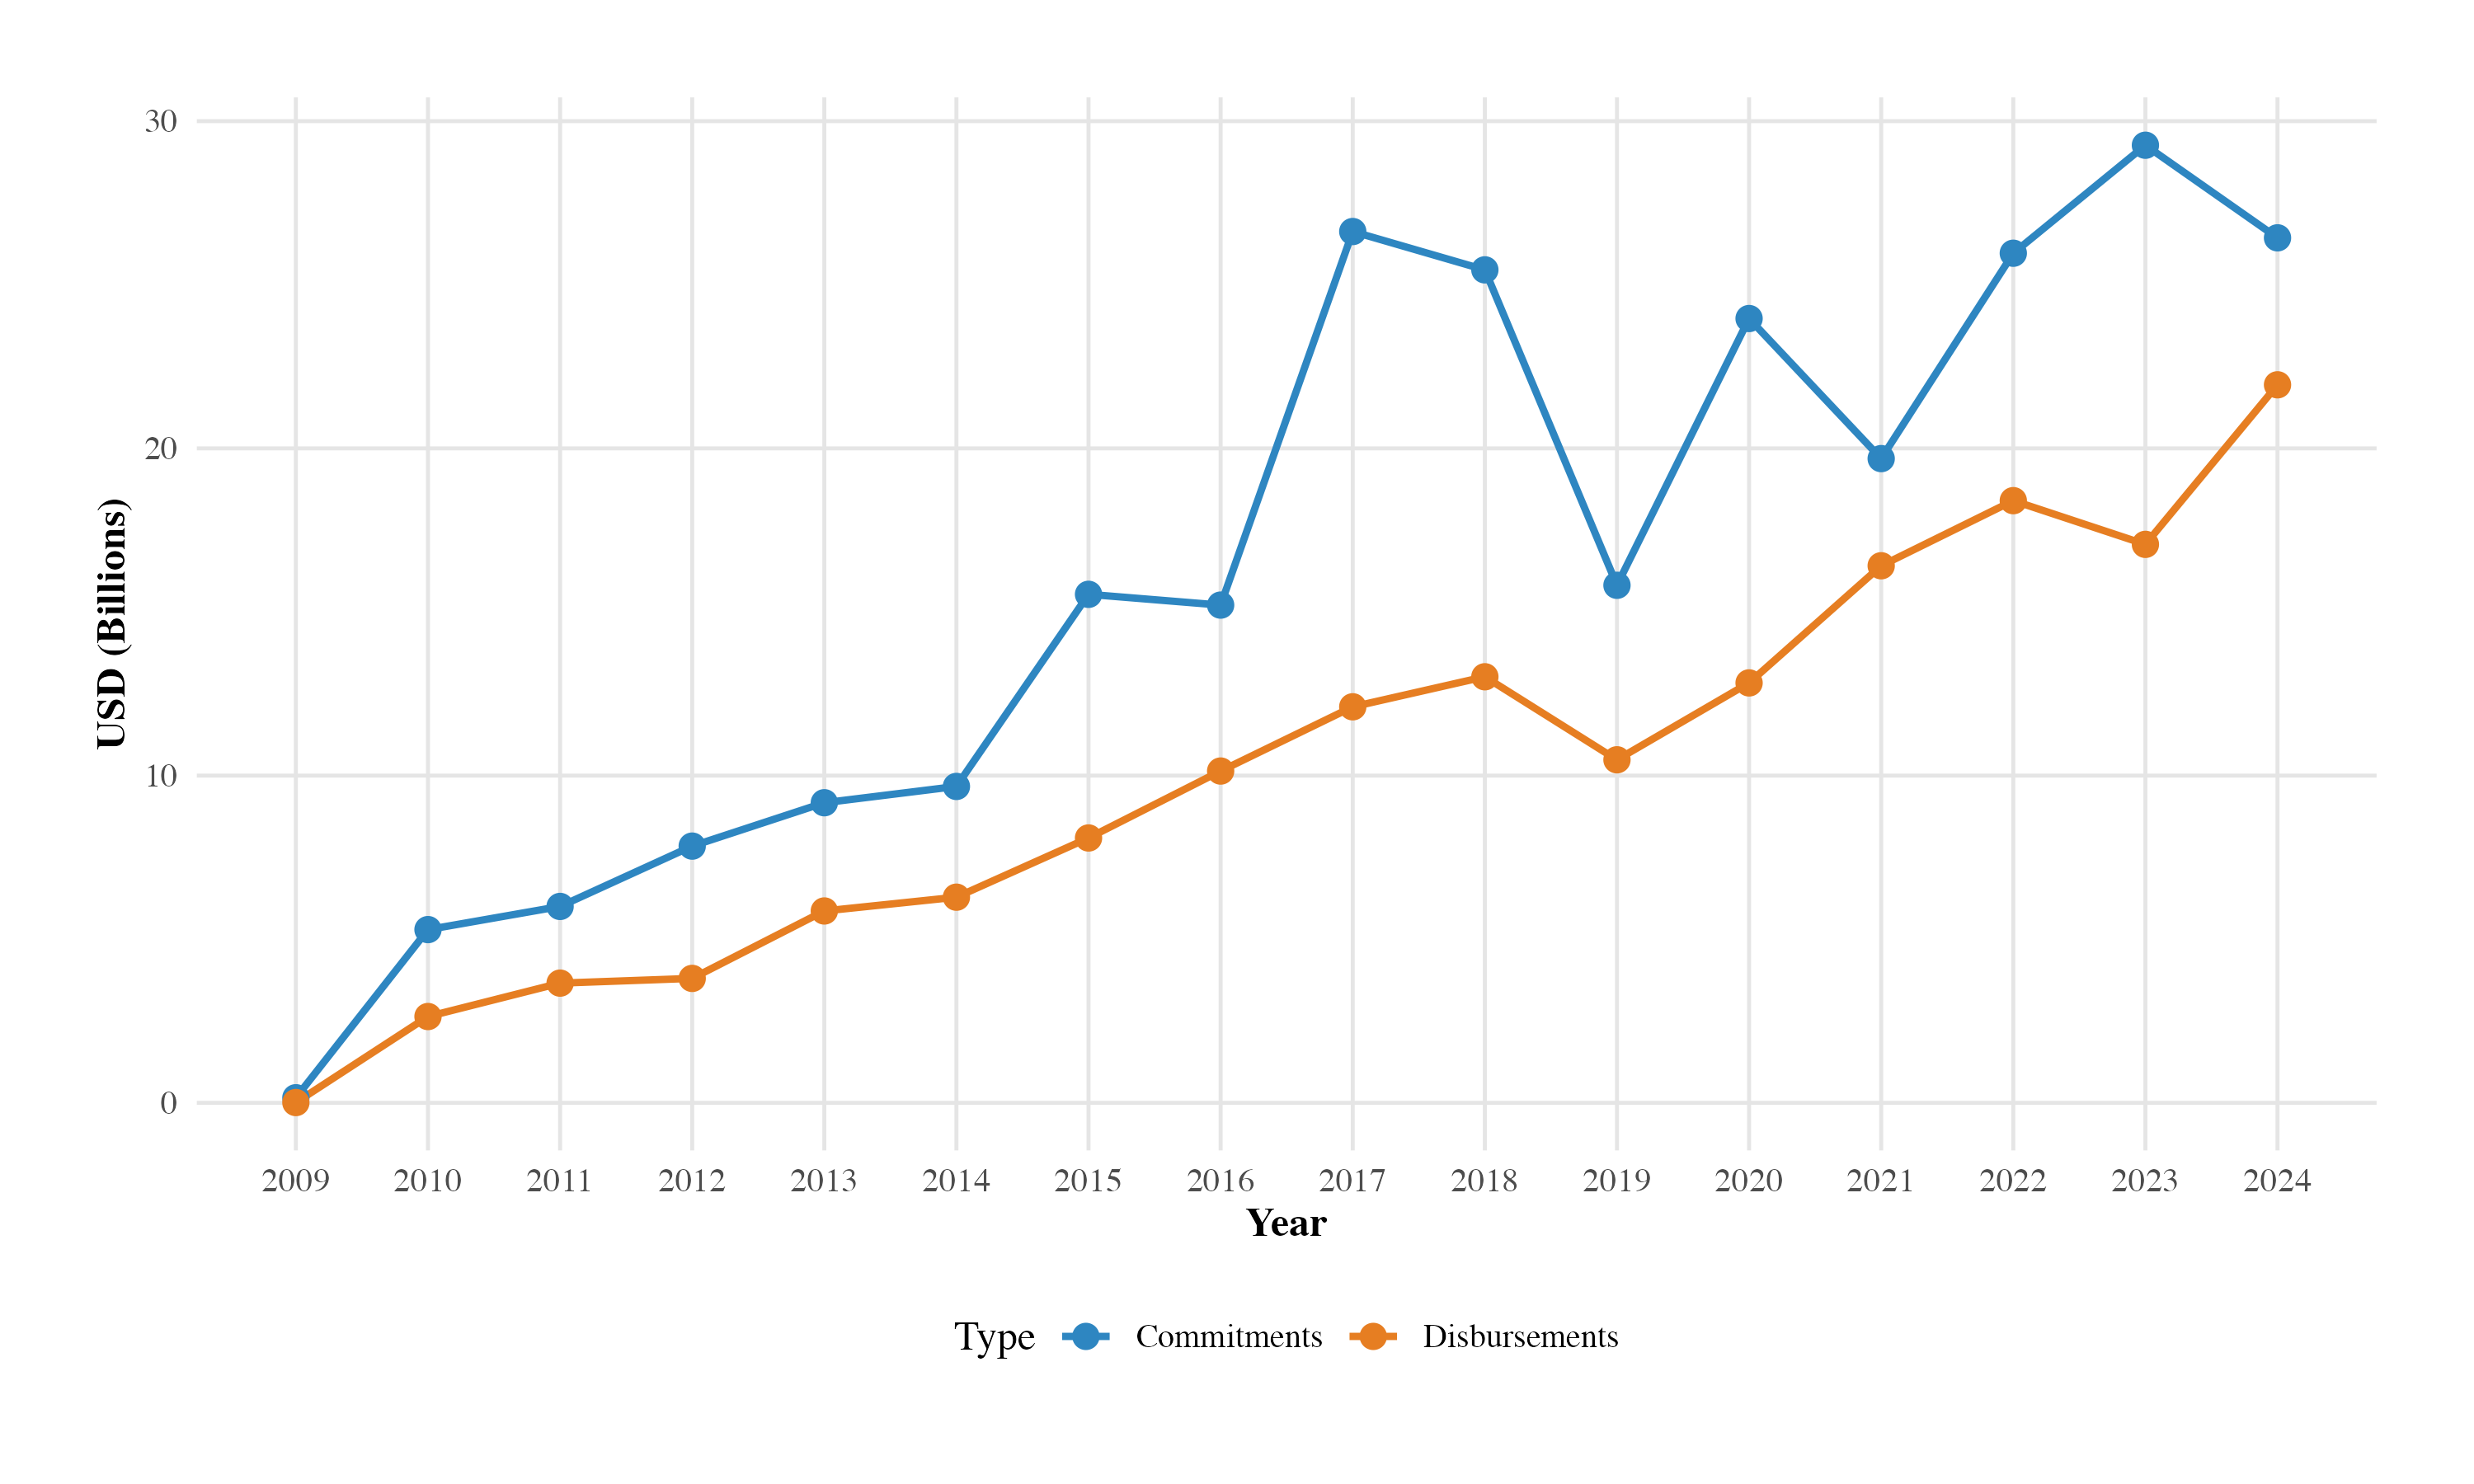
- Adaptation finance: OECD Creditor Reporting System project-level commitments tagged with the
Rio adaptation marker (principal or significant), aggregated to the recipient–year level over 2009–2024.
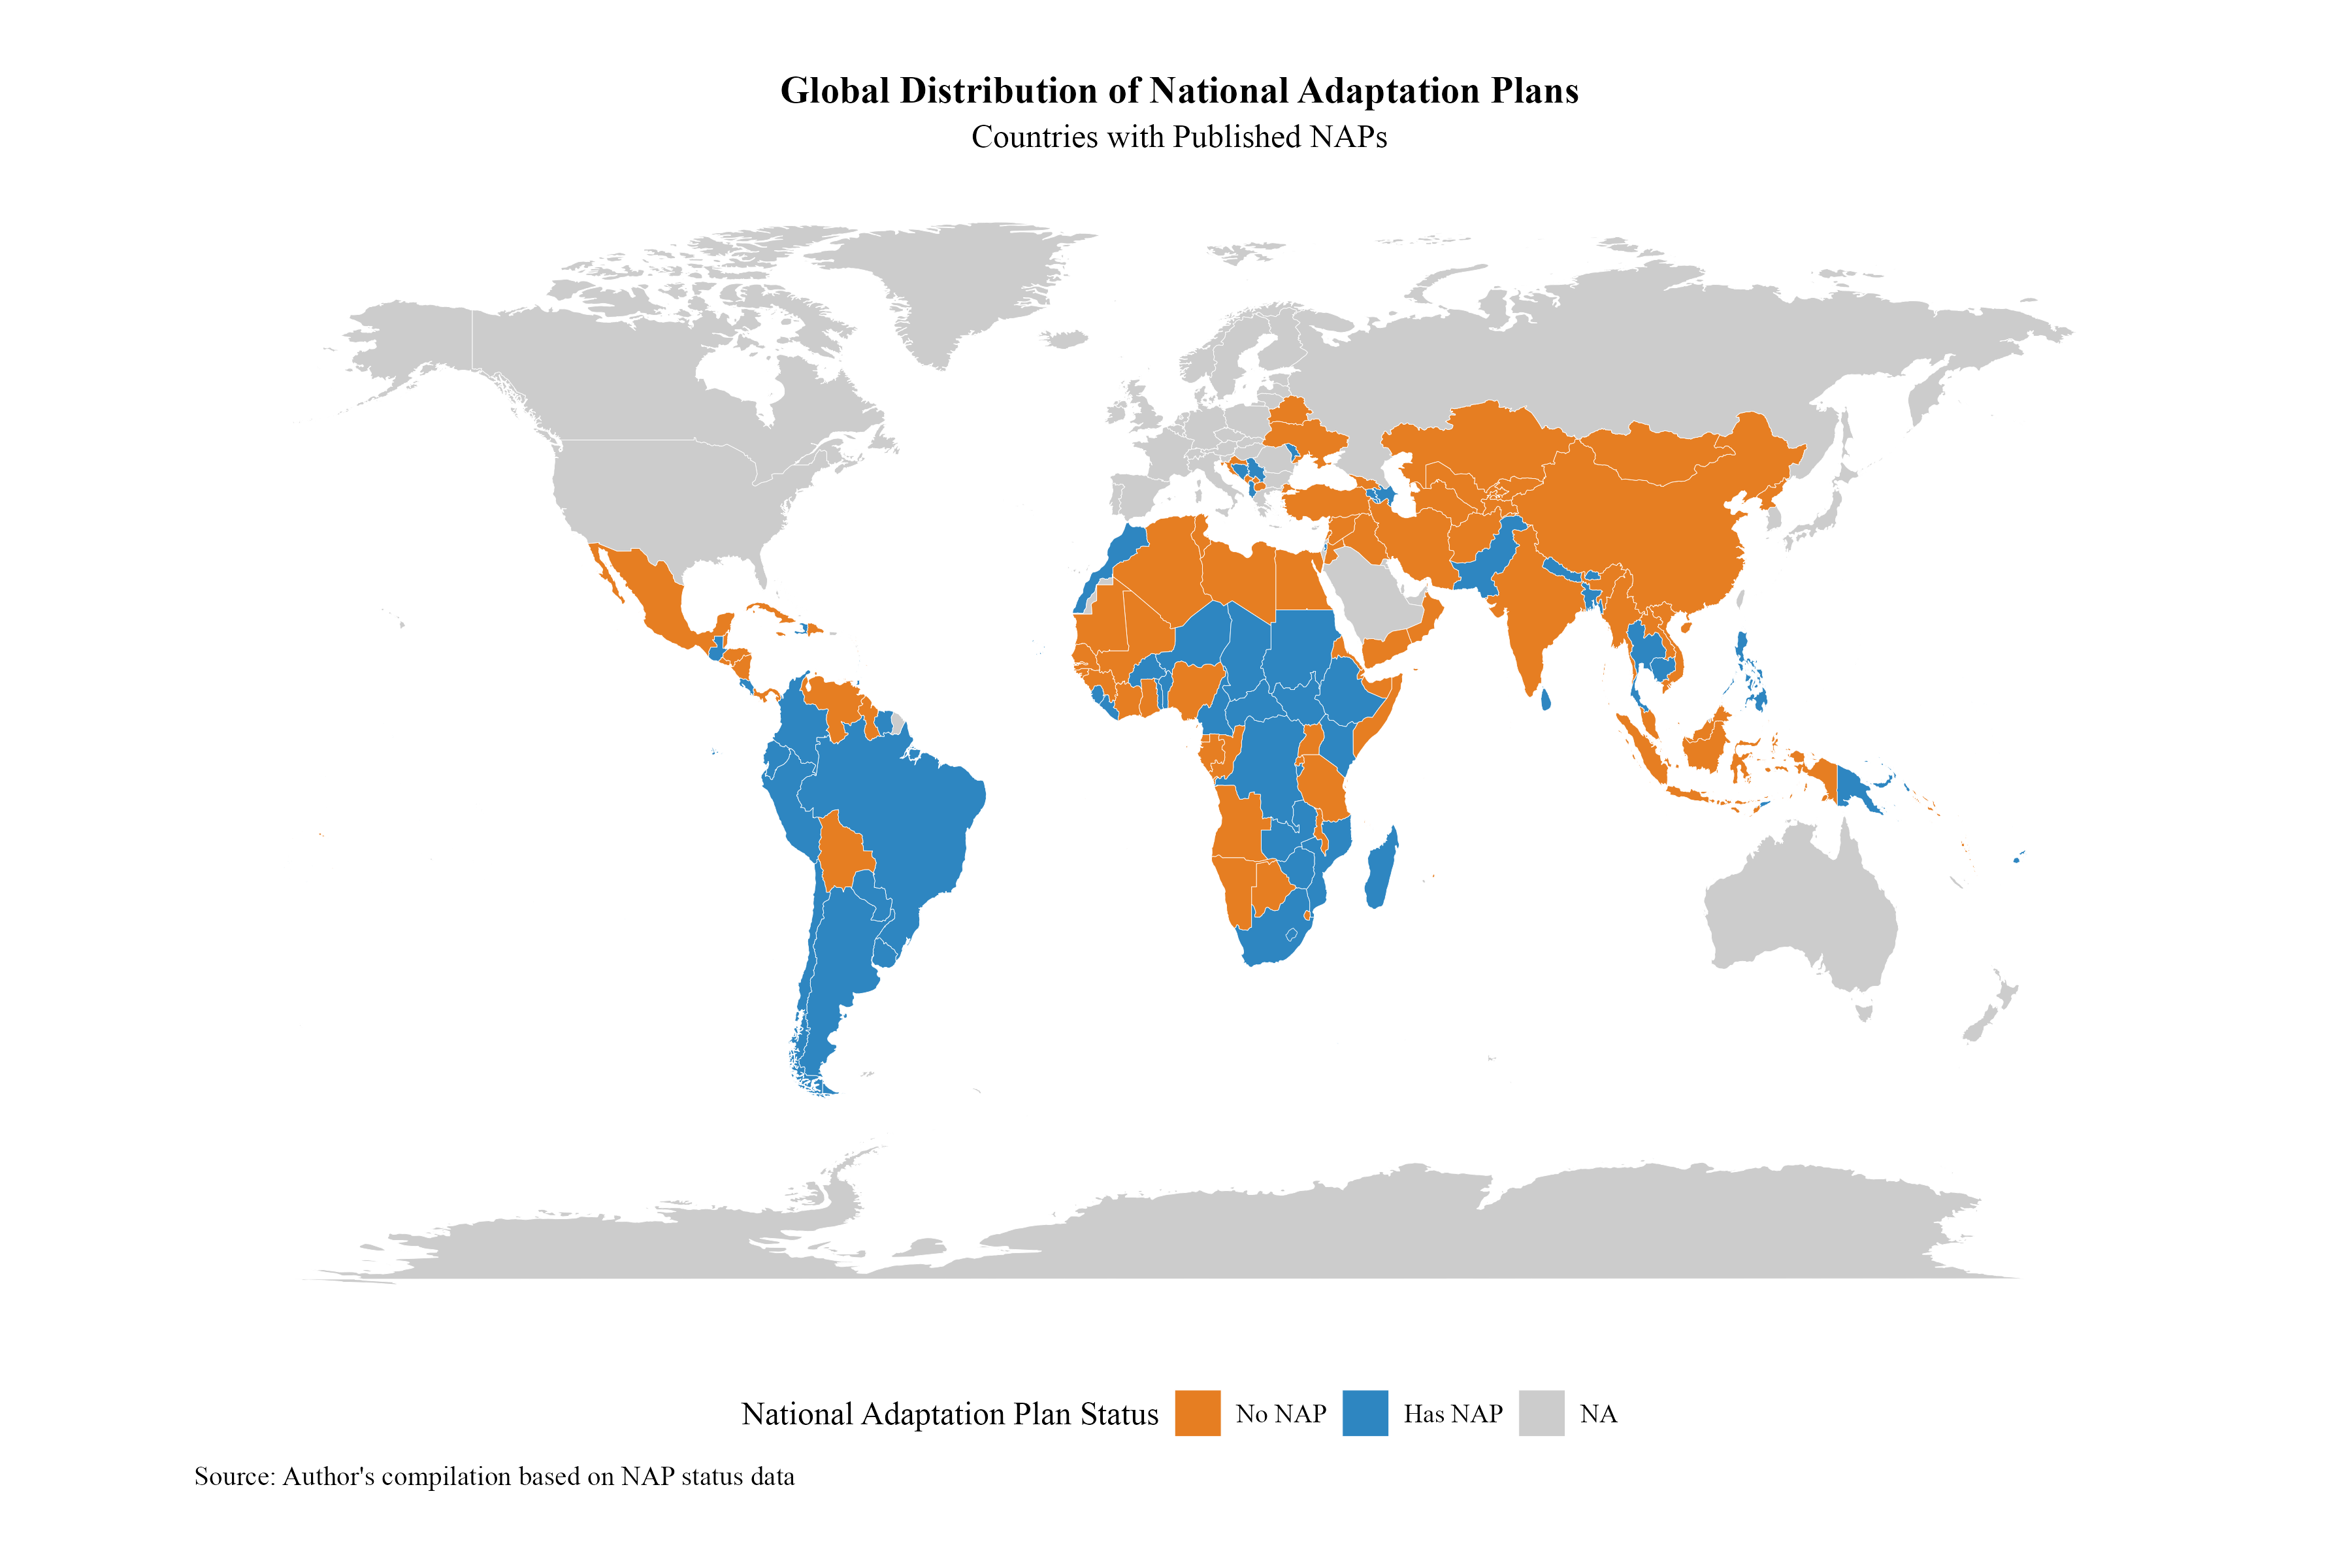
- NAP adoption: the year of first official NAP submission to the UNFCCC (NAP Central tracking tool),
an absorbing treatment.
- Controls: pre-treatment WGI Government Effectiveness and log population, both evaluated at
g − 1, plus country and year fixed effects.
- Estimation: the Callaway & Sant'Anna (2021) staggered difference-in-differences estimator
(doubly robust, never-treated comparison, multiplier-bootstrap inference), corroborated by
de Chaisemartin & d'Haultfœuille (2024) and a Goodman–Bacon decomposition.
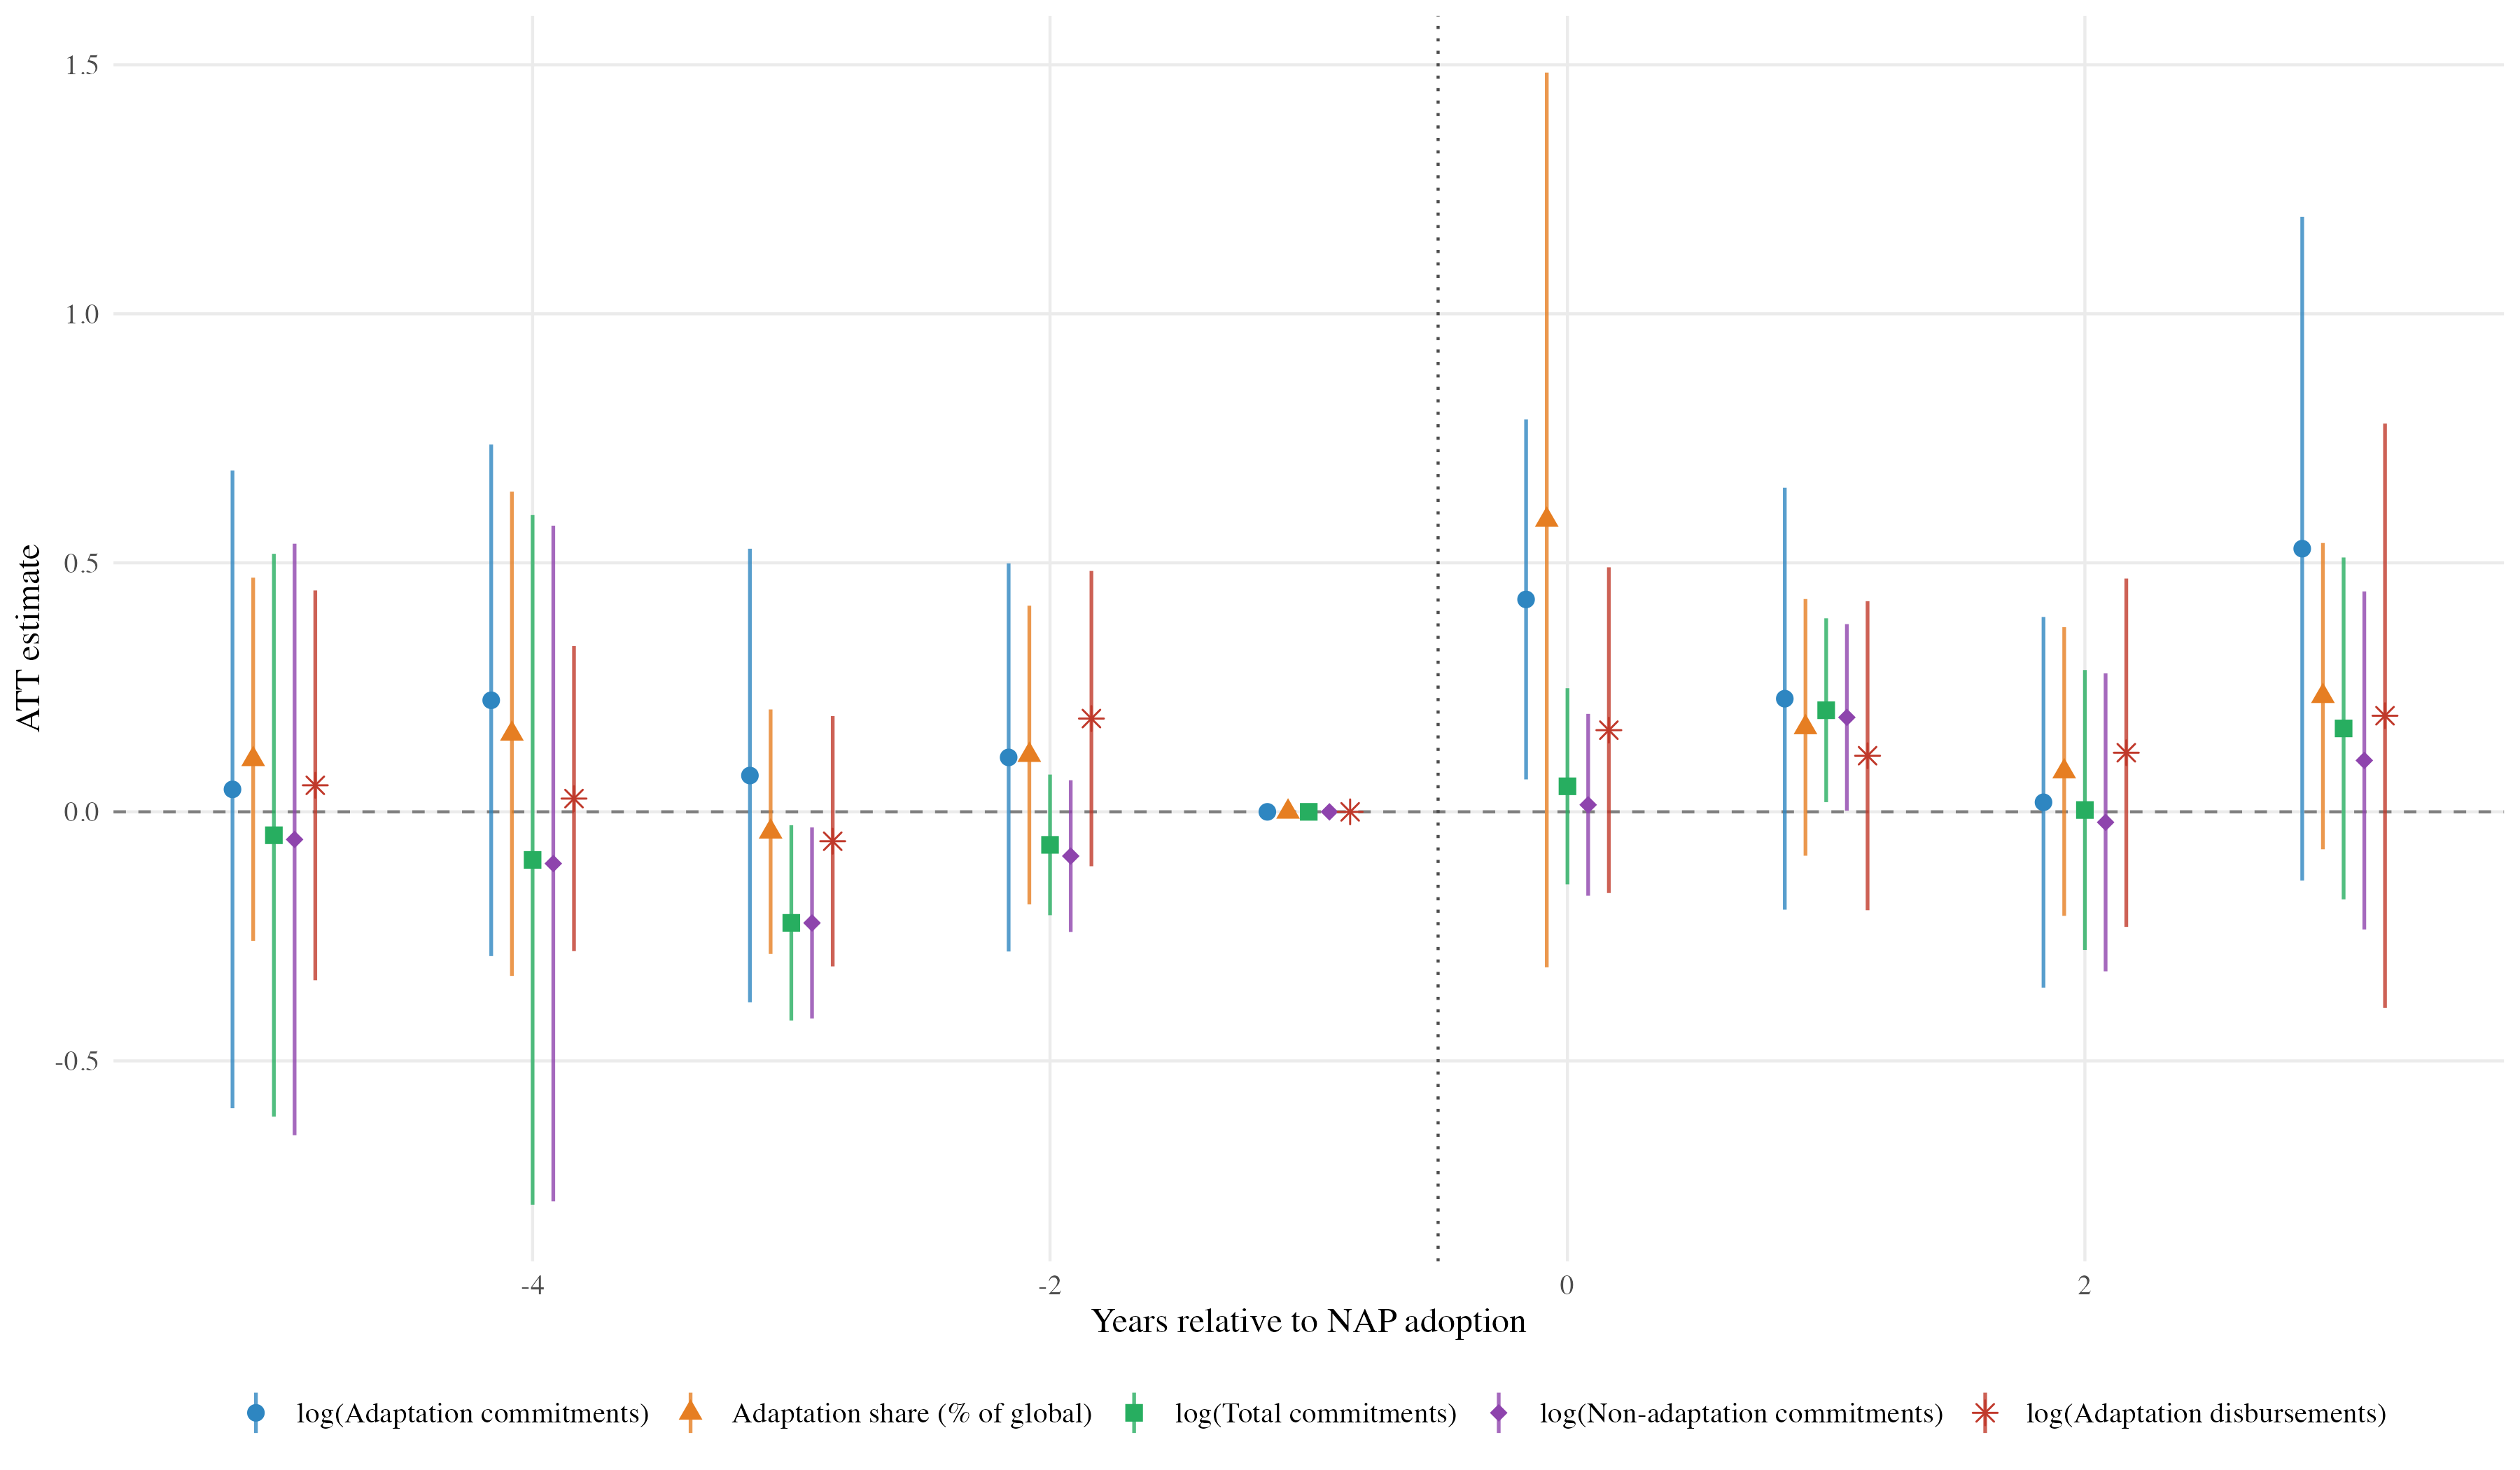
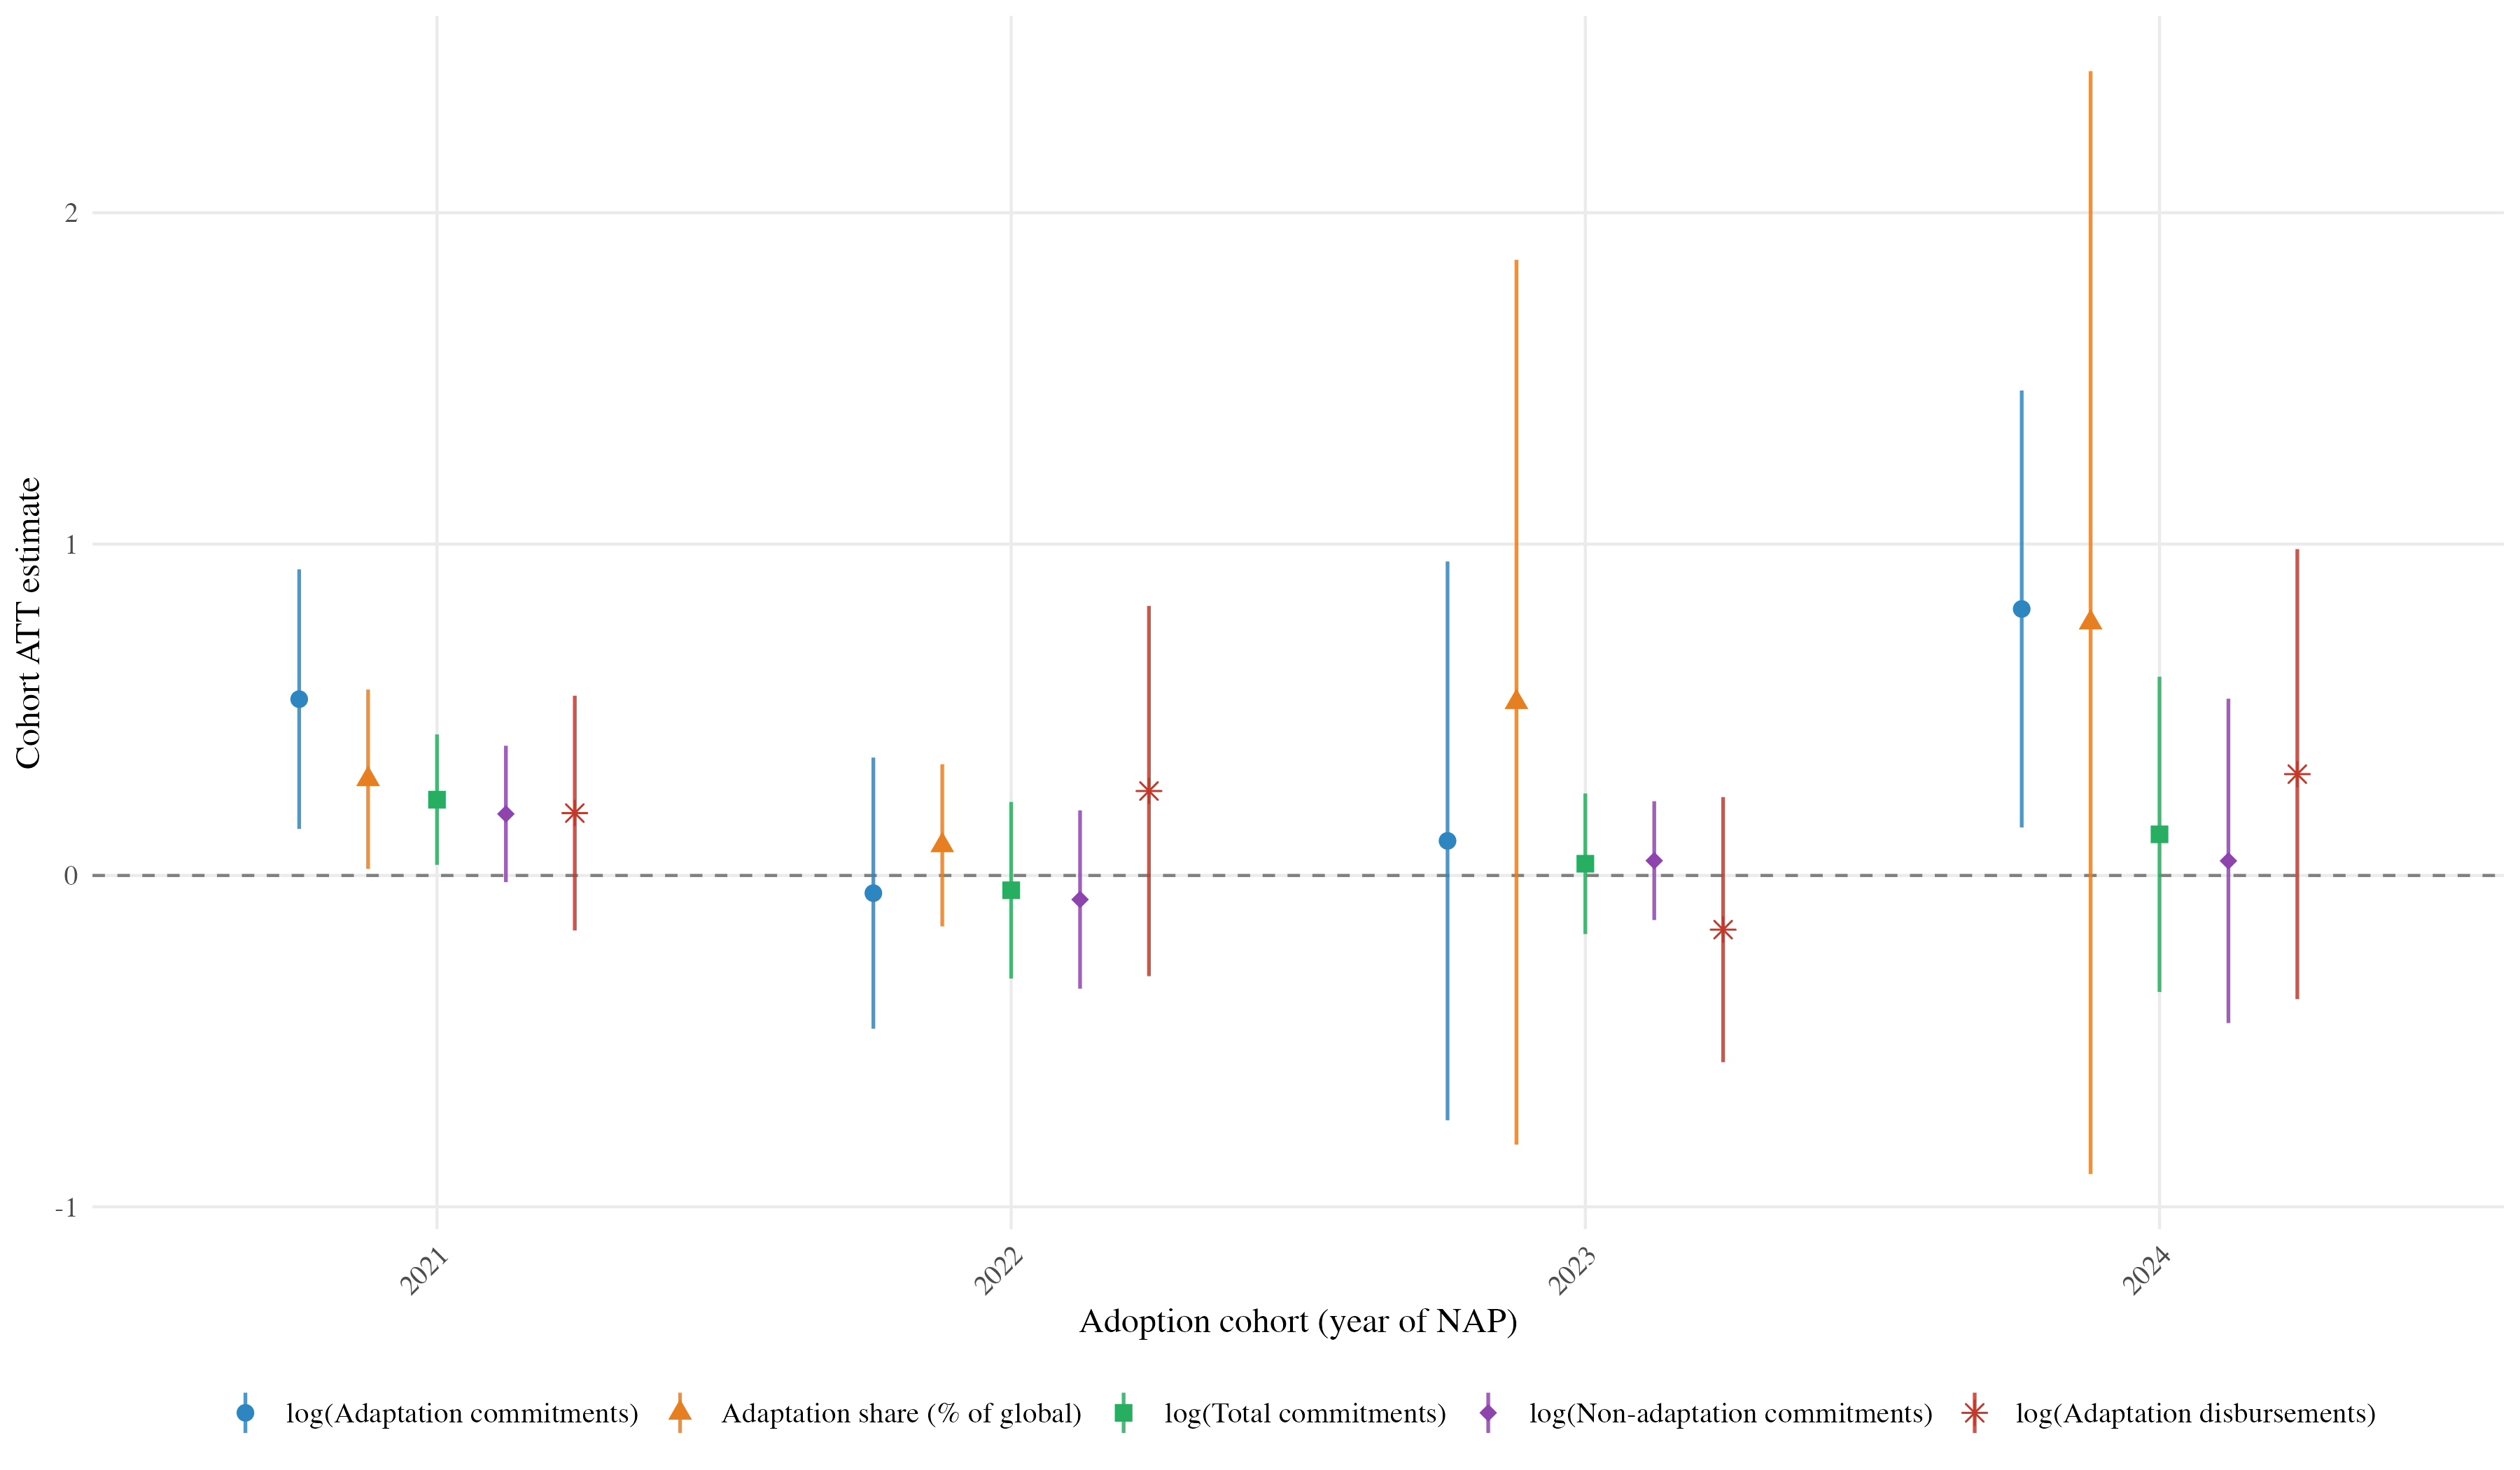
Average effects. The ATT on log adaptation commitments is 0.294 (SE = 0.125,
p < 0.05), a ≈ 34% increase. Total commitments (0.101) and non-adaptation commitments (0.071) are
statistically indistinguishable from zero. The effect is reallocation within a roughly constant envelope
— the model's composition channel — not an expansion of overall finance. The country's share of global adaptation
finance rises by 0.32 percentage points (SE = 0.140, p < 0.05). Disbursements move in the
same direction but are imprecise (0.142), consistent with implementation lags.
Dynamics and mechanism. Adaptation commitments rise progressively after adoption rather than jumping
on impact, consistent with donor programming cycles. A placebo test shifting treatment two years earlier
yields a null (ATT −0.019), and a mitigation falsification — an outcome NAPs carry no mandate over — shows no
significant effect, sharpening the reading that donors respond to the adaptation-capacity content of a NAP
rather than to a generic climate-policy posture.
Who responds. By donor type, the effect is driven by DAC bilaterals (≈ 36%, p < 0.05) and
multilaterals (≈ 74%, p < 0.05), while non-traditional donors show no response — the pattern
predicted for capacity-screening donors. The effect is concentrated in below-median-governance adopters and among
low- and lower-middle-income countries (≈ 38–52%), consistent with a credentialing interpretation. LDC/non-LDC
splits are imprecise, most plausibly because the LDC estimation sample contains only 17 countries.
Robustness & caveats. The headline effect is stable across alternative comparison groups
(not-yet-treated), outcome units and the treatment of zeros (the unit-invariant intensive-margin and PPML
estimates give ≈ 33% and ≈ 45%), and two heterogeneity-robust estimators. We are transparent about limits: formal
pre-trend tests reject for the total and non-adaptation outcomes (so the "flat envelope" reading is
suggestive, not established), and HonestDiD sensitivity shows the positive adaptation and share effects are
guaranteed only for parallel-trend violations below 25% of the largest observed pre-trend — warranted caution
given the short post-treatment window.
Bottom line. NAPs pay — not by equally expanding every envelope, but by signaling readiness to
the donors who respond to it, shifting each adopter's envelope toward adaptation and reallocating global adaptation
finance toward adopters within a broadly constant total. Because the mechanism rewards the capacity (merit)
dimension of climate risk, it also risks steering finance away from high-need, low-capacity non-adopters — the very
need–merit trade-off the framework makes visible.